It’s been said that a picture is worth a thousand numbers and there is hard science to back this up. The human brain processes images 3X faster than text, and our brains excel at the task of subtle pattern detection, and interpretation of meaning. The visual system is extremely powerful – we process the visual field at once, and we can spot trends and outliers very quickly.
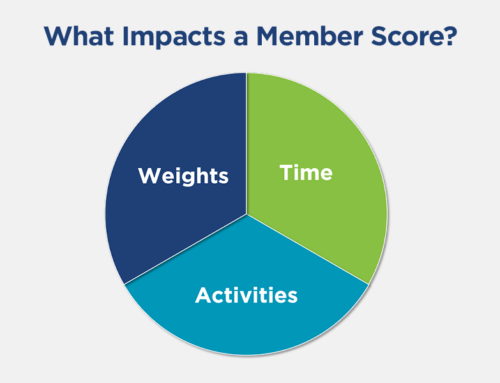
So what is it exactly about visual images that make data so much easier to understand? It’s the mind’s ability to quickly see the most important information and to detect relationships. Pictures and colors allow us to take mental shortcuts. We understand the red stop sign and the yellow warning symbols even before reading the words. Remember how the light bulb went off in elementary school when we learned how relationships between sets could be represented visually with a Venn diagram?
Today we have more data available than ever before. Yet we have less information. We all yearn for an easy to way to understand data quickly. Enter the era of data visualization.
Business Benefits of Data Visualization
- Visual patterns surface quickly
- Visualization is dense – many data points presented in a small space
- Accelerates time to insight
- Key to adoption and success of Business Intelligence (BI) projects
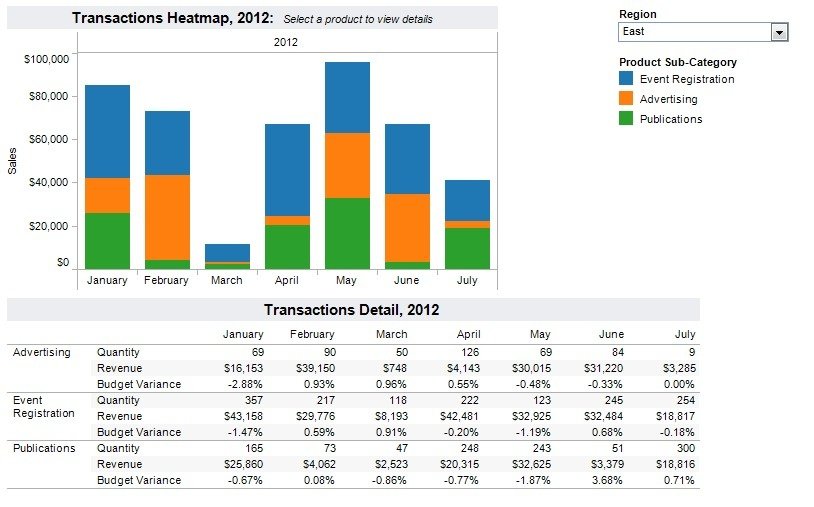
When we look at a table with numbers, our minds generally first focus on the largest numbers, then we mentally perform the task to convert the numbers into images that show how they relate to each other – for most people this is a vertical bar graph. In this way we “see” in our imagination how the largest number relates to the other numbers. But using a simple image such as a bar graph from the beginning, frees up the mind from the task of constructing the comparison and allows the mind to focus on the most important questions of all – what does it mean and what should we do about it?
Here is a simple example. Which of these representations allows you to quickly determine the month with the highest total sales? Obviously the bar chart. But what you can also do is immediately see the relationships between the sub-categories, months and totals, which are lost in a table. With a quick glance it is possible to see there is a problem with March, which is not evident by looking at the table. Days later, chances are we’ll remember the image, not the numbers. The best data visualization tools also allow you to click on the colored bars and drill all the way down to the line item level.
Human beings have an incredibly refined ability to perceive patterns based on position, size, color and shape. Data visualization allows us to see important patterns and correlations quickly without getting lost in the details.
Data Discovery
In the field of business intelligence, data discovery is the process by which we find the answers to the questions we have – namely the things we know that we don’t know. An important part of data discovery is the ability to present the data visually one way in order to simulate the mental conversation and allow us to interact and “ask” meaningful follow-on questions of the data, and then “re-present” the data another way, once more is known.
We are inspired when we see data visually and notice how it changes based upon the questions we ask. We can see the power as we interact with the data and the analysis process become a natural extension of the activity of thought, enabling us to drill down, drill up, filter, bring in more data sources, or create multiple visual interpretations. Interactivity supports visual thinking. We can work with the data visually at the speed of thought, rather than writing queries to the databases. We can learn and reach insights faster. When we interact with the data visually, we are participating in the data discovery process and data becomes our ally, our partner in gleaning the information that becomes business intelligence.
Once we have tackled data discovery we can start using predictive analytics and time series analysis to move beyond what we know we don’t know – to uncover the patterns, correlations and opportunities hidden in the domain of “what we don’t know that we don’t know”. Data visualization is the first step down the BI path because it is interesting, understandable and can deliver compelling results quickly, making us yearn for more. This is an important point that bears repeating – because data visualization is interesting and engaging it can effectively speed the adoption and success of a business intelligence project.
Big Data = Big Opportunity for Data Visualization
The term “big data” is used when referring to extremely large data sets that can change rapidly and include both structured and unstructured data. Big data is often characterized by the three dimensions of volume, velocity and variety. Data visualization shines with big data, allowing us to quickly comprehend relationships we would never be able to grasp if presented as rows and tables, even in summary form. It fact it’s a whole new field – we used to have to be content with sampling large data sets, but with today’s tools we can analyze entire populations.
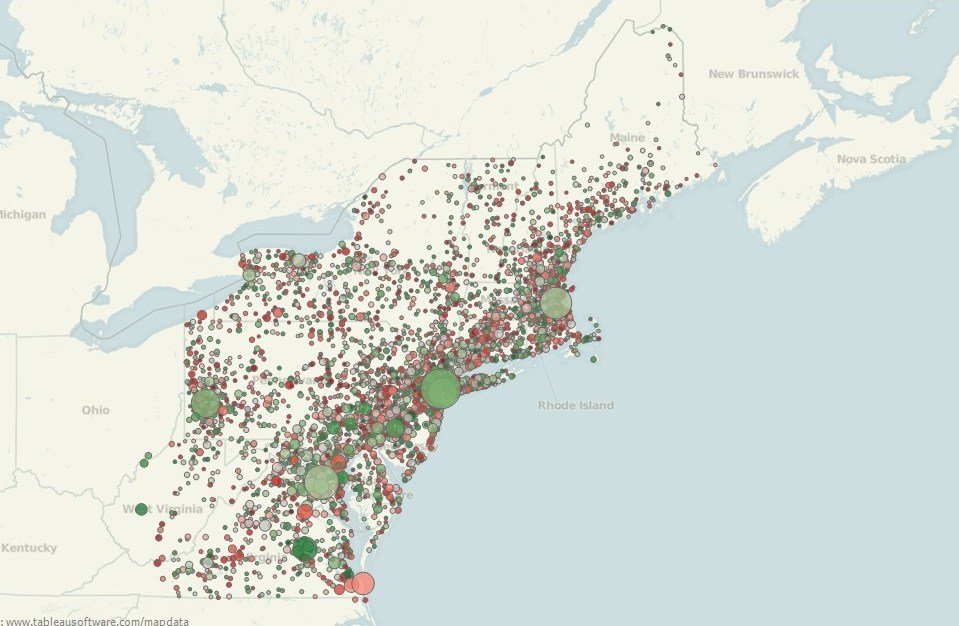
The example below is a simulation of a big data map where we have combined social media data with CRM data to show activity in the eastern region of the United States. The green dots represent members and red are nonmembers. The larger the circle, the more activity. Of particular note are the larger red dots which represent an immediate opportunity for membership.
Because of our ability to understand relationships quickly based on size, position and spatial attributes, the eye can understand visual data much faster than what might otherwise require thousands of numbers to convey and a long time to comprehend. Data visualization enables us to see and understand the stories our data is telling us. With the advent of big data and the pace of change, we need to able to quickly interpret data so that we can take action and change our future for the better. That’s the power of data visualization.