Have you ever heard of the term “Modelstorminig”? It’s where data modeling meetings brainstorming and it is the best way we have found to build scalable analytics solutions in an agile fashion. In the old days, when analytics professionals started gathering requirements for a business intelligence initiative, it was easy to fall into the trap of just doing what we were told. The association staff wants field X, Y and Z and they are used to A, B and C reports. We give it to them. Everyone is happy. For a minute. Then, they have new questions. Then we repeat the whole process again. It’s time-consuming and frustrating for both the business staff and the IT staff. As they say, “times are changing” and that old model simply doesn’t work. Today we seek to answer both the questions the association staff have now and those they will have in the future. We try to answer questions they don’t even know to ask yet. This is what is means to “have a conversation with the data”. So, how do we do that?
- Listen
- I know about ETL scripts, star schemas, and building visualizations in Tableau. Those are a few of my strengths. What I am less familiar with is the business processes of a client. What does it take to get a new member? What marketing or product development tasks go into membership? How do most people join? Are they a prospect before they are a member?
- The answers to these questions help me understand the business and help me understand what questions they may have that go beyond “How many new members do we have?”
- Discover Business Events
- We are delivering solutions that the business can actually use and even, I dare say, enjoy using. The association staff should be part of the entire process so that they understand it. This starts at the very beginning.
- We ask the association staff to convey their data stories using subjects, verbs and objects to discover the business events and tell data stories. Business events are the measurable details of a business process. We ask “Who does what?” The answer might be: “individual registers”.
- Document
- This isn’t boring old documentation! Using whiteboards and spreadsheets and a framework, we collaboratively model the events with association staff in a workshop-type setting where everyone is engaged and active. The documentation we start during the requirements/scoping stage is used throughout the business analytics phase.
- Uncover Event Details
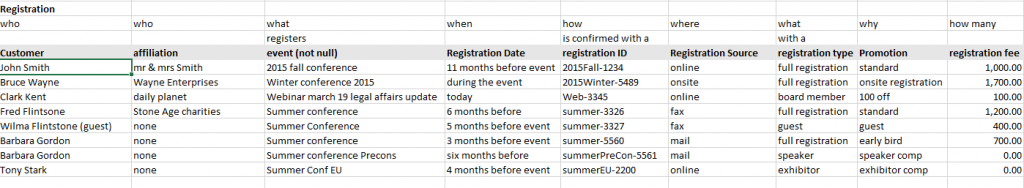
- Using the 7Ws: who, what, when, where, how many, why and how the association staff describes the details of business events. This helps us determine, in a painless way, how we should store our data – the granularity and even the structure, including hierarchies. Then, together, we start to build out an easily recognizable table of these events that everyone – business and IT – can understand. Now, our business event might be: “Individual registered yesterday for an annual event online using a source code.”
- Discuss examples. What might a typical registration event look like? What might a registration look like that is not typical (an exception)? What is the range of dates individuals can register? Can an individual register for more than one event?
Below is a sample matrix which maps a registration event:
These initial discussions are exciting and enlightening and pave the way towards successfully adopting business analytics.
Note: We use much of the framework discussed in the book Agile Data Warehouse Design by Lawrence Corr. It’s a good read!