Simon Sinek in his famous TED Talk, “How Great Leaders Inspire Action“, explains that inspired leaders and organizations all think, act and communicate the same way. They start with “why“. Only once they are clear about “why” do what they do, do they tackle the “how” and “what”. In other words, they think, act and communicate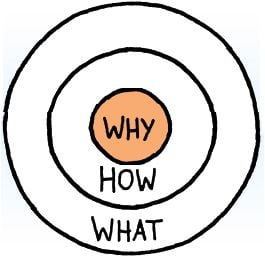 the opposite of everyone else – they start on the inside of the circle and move outward. For me, this philosophy applies to association analytics as well. When I am asked, “Where should we start?” my approach is to first get very clear on “why” you do what you do – what is your organization’s purpose from a strategic point of view? If your primary mission is to educate your community of interest, then everything else that you do should be evaluated in that light. How you do it, and what you do, come after the why. Sounds simple, but in practice it’s not as easy as it sounds because we are not used to thinking this way. And as important as it is to identify the “why”, it is every bit as important to measure the “what” and the “how” so that you know whether you are achieving the “why”! That’s where analytics are essential. For example:
- The primary mission of one of our association clients is to educate people (this is their “why:). They have a strategic objective that is expressed this way (action + measurement + date):
“Triple the number of professionals we educate within five years.” - In order to achieve this aggressive objective, they identify what seems like a logical initiative (this is the “how” and the “what” and is the tactical approach to meeting the strategic objective), in this case:
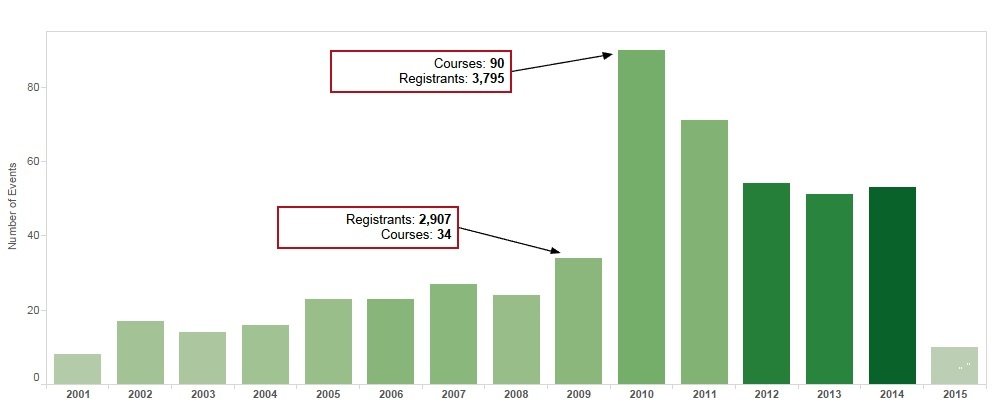
“Triple the number of courses we teach.” - They then use analytics and data visualization to measure the results of their initiative and find that in one year alone they almost tripled the number of courses from 34 to 90 – however they only educated 888 more people! In fact, even though they did educate more professionals, they lost money because of the extra logistics required to teach so many courses and it was not economically sustainable. At this rate they would fail to achieve their strategic objective and their “why”. In the visualization below, you can see the number of courses indicated by the height of the bar, and the number of participants is indicated by the depth of the green.

- When they stepped back and used data discovery to analyze the data, they were able to clearly see the patterns of participation. Registration was primarily related to location. So they formed a new initiative: “Locate and market our courses in the areas most densely populated by our target population.”
- Within five years, they were able to consolidate the number of courses and more than triple the number of registrants:

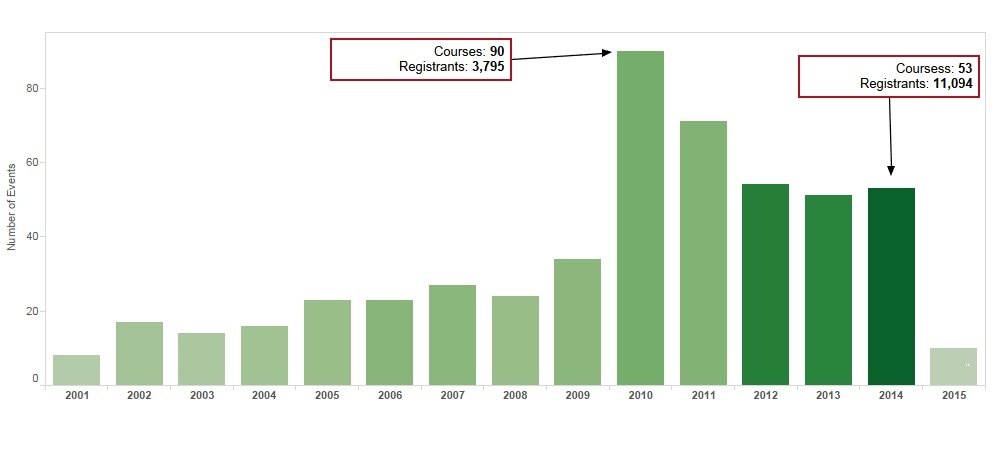
Analytics helped to clearly illustrate that the initial “what” (triple the number of courses) was the wrong approach. With continued focus on the “why” – to educate more people – they were able to shift their initiative (concentrating courses based on location and target population) to exceed their strategic objective within five years. There are many ways data anlytics can help identify and measure initiatives you can undertake that will address the “what” and the “how” – but first start with “why”.