How do your customers connect with one another? Social media mixed with a historic mathematical theory can help you find those patterns and bridge gaps.
Combining social media with other external data can help your association use a range of personal interaction and engagement to move toward a more customer-focused approach. Analyzing social networks is often done through the mathematical concepts of graph theory and network theory, showing relationships between individuals. Richard Brath and David Jonker described using these concepts for business in their book.

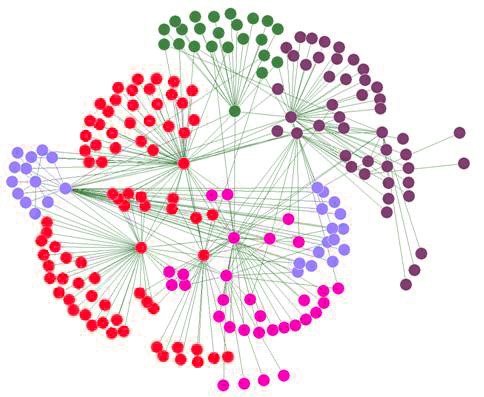
Using technical analysis helps you identify people who are “connectors” and link to several groups, “influencers” who help groups form, and cliques that would otherwise be difficult to detect. Setting people up as a simple shape and line graph can be understood by:
- Counting incoming and outgoing links between people.
- Looking at the density of direct connections.
- Examining the shortest and longest paths between people.
- Considering how far the shapes are from one another.
- Seeing how people tend to cluster together.
Graph analysis comes just from activities and does not make use of other attributes, like demographics. You can supplement this analysis with other data that you have. You can also use this kind of analysis to identify customers similar to the ones you found through social network analysis. It may be interesting to study things like how members’ interaction levels differ from those of non-members.
To bring social media data together with your other customer information, it should all come together in a data mart. In addition, you can also introduce text analytics to provide additional context. Different social media platforms make data available through application programming interfaces (APIs), which all have their own technical integration options and data scopes.
While social media analysis has been getting more popular recently, the graph theory that is used to break it down is centuries old. Mathematician Leonhard Euler famously used this theory in the 16th century to solve the “Seven Bridges of Königsberg” problem, devising a way to walk through a city while crossing each of its seven bridges only once.
While crossing physical bridges may not be on your list of priorities, social network and graph analysis can help cross several metaphoric bridges in your association, including:
- Segmenting customers: Coming up with similar people, based on links and attributes.
- Analyzing influence: Finding people with large numbers of connections and activity.
- Analyzing the market basket: Figuring out items that are commonly purchased.
- Finding general correlations: Seeing relationships between people, products, events and other things.
- Website visit analysis: Determine which webpages are the most popular.
Visualization techniques can communicate the message in social network data through node size, node color, link weight, link colors, and labels. You can use a combination of visualization choices in Tableau to tell social network stories.