As you know, at DSK we love data visualization. It is the quickest path to understanding what all of that information you are gaining from your members is telling you. As you create visualizations from your data, here are a few things to keep in mind in order to make your message clear and ensure your visualizations are effective:
- Simplify the elements in your visualizations to highlight what is most relevant. Axis labels, colors, and grid lines should all be simplified so that the user’s attention is focused on the main point(s) of the visualization.
- Provide all necessary guidance to your user. Elements such as descriptive titles, well-labeled axes and values, and legends are very important to clearly communicating the meaning of your data. Categories and trend lines should be described in an easy to understand legend. Your goal is always to provide adequate context for the user to discern the relationships in the data.

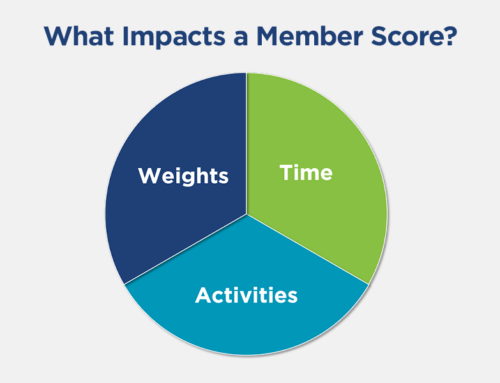
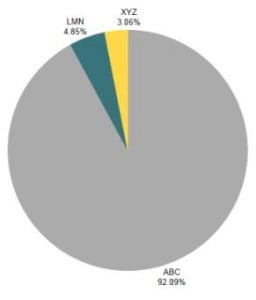
- Despite their bad rap, pie charts are very effective in some cases. They are quite useful for a quick view of the segments that make up a whole – when there are just a few segments. Pie charts must always add up to 100% and each segment should be labeled. Never use a 3-D pie chart. The eye can’t easily compare the area or the angle of the data from this type of rendering.
- A user should be able to quickly and easily understand important relationships between the variables in a visualization. Adding too much information to a single graphic eliminates the advantages of processing data visually. Try changing chart types, reducing the number of colors, and don’t provide excessive or unnecessary detail.
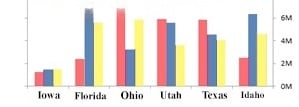
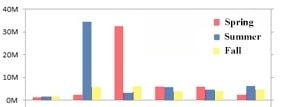
- Bar and column charts should always start at a zero baseline to eliminate the possibility of confusion or of the user drawing inaccurate conclusions. If you have one or two very tall bars, consider using multiple charts to show both the full scale and the detailed view.


- Never remove data points that don’t support your story. Showing only the data that supports the point(s) you are trying to make is essentially the same as lying with your data. This is not something you want to ever do, and you must guard against it by making sure you show everything and not omit data that might change the story you want the data to tell. Don’t distort what the data has to say.
Following these suggestions will help you accurately and clearly tell your data’s story to executives, members, and constituents.