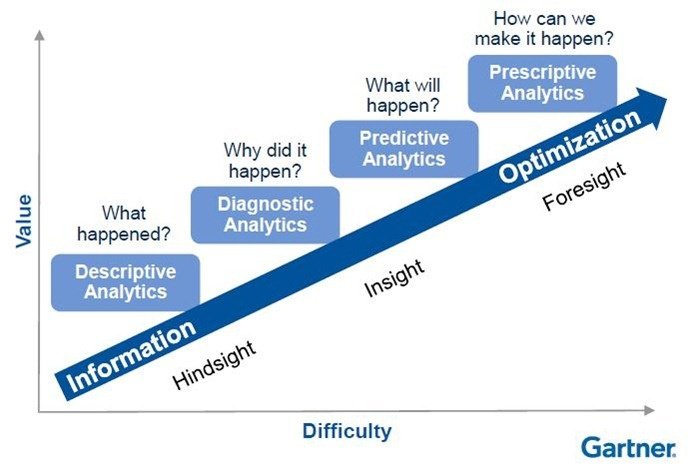
The oft-cited Gartner image depicting an analytics maturity model shows different forms of analytics that associations can use to understand customers and make decisions with confidence. We’ve previously discussed how Predictive Analytics can provide valuable insight into your association business, but how can you move towards Prescriptive Analytics to answer ‘how can we make it happen?’ One way to get there is through “What-if” Analysis.
What is “What-if” Analysis?
“What-if” Analysis is the process of changing the scenarios or variables to see how those changes will affect the outcome. Associations might use this when they have limited data for making a decision or they’re considering launching a major new program. This type of analysis can help you make decisions with confidence.
With “What-if” Analysis, you begin with the end in mind while exploring a world of possibilities in your association’s data. It is a great way for your association to apply models developed for Predictive Analytics to move towards prescriptive analytics. “What-if Analysis” incorporates predictive and other models demonstrating data relationships and allows you to measure the potential impact of different strategies. Here are potential questions that What-if Analysis can help answer:
- How will different levels of membership dues impact overall revenue?
- Will changing the location of a conference increase attendance?
- What marketing channel allocation will maximize conversion rates?
Potential Challenges of “What-if” Analysis
Implementing multiple models and making data assumptions present certain challenges, such as:
- Data relationships might not be linear – customers eventually encounter diminishing returns as their activity increases
- Other data relationships may emerge – increasing meeting attendance could decrease training course attendance
- Price elasticity is not uniform at untested levels – the impact of price on customer decisions may not be easily estimated
Another key consideration is understanding when fundamental changes over time change previously discovered data relationships. Although the past is often the best predictor of the future, this is not always the case. You can identify instances of data changing over time by consistently monitoring and exploring Descriptive Analytics based on historical data.
These challenges demonstrate why you need analysis beyond basic spreadsheet features.
Getting Started
You can perform basic “What-if” Analysis in Microsoft Excel. However, you can take your “What-If” Analysis even farther, with these tips:
- Get a Data Visualization Tool. You will want the power of interactive data visualization using tools, such as Tableau, to rapidly adjust data inputs and understand resulting changes.
- Validate Data. You need to continuously re-validate models and measure the effectiveness of models to ensure the ongoing effectiveness of your models. Be sure to include this when you are considering resources. Also, not all data is created equal. You can use sensitivity analysis to identify the impact of individual variables on different outcomes.
- Encourage “What-if” Questions. “What-if” Analysis works best in an innovative culture where intellectual curiosity is encouraged. Reward staff for experimenting and questioning long-held beliefs.
You can move your association towards Prescriptive Analytics to truly have conversations with data and create the future. So, now think about your own “what-if” questions!